
Structural Analysis - Experimental Variogram

In a previous post, we provide some highlights on how to represent the structure of a regionalized variable by using lagged scatter plots. In this article, we will explore the concept of experimental variogram.
For a second-order stationary variable, as those we have analyzed, the variogram is defined as:
The previous expression can be written in a compact notation as:
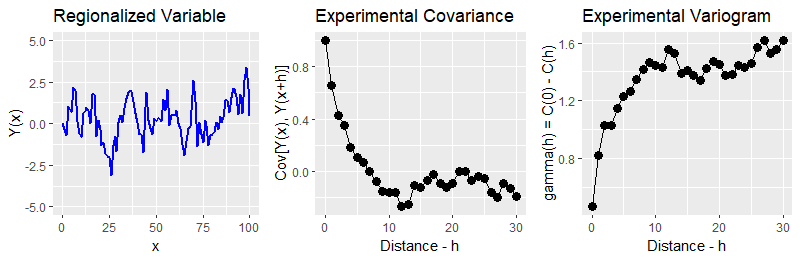
Using previous definitions, it is possible to determine the experimental variogram of a regionalized variable, in this case:
It can be observed that the experimental variogram gradually increases until reaching a sill (Figure).
The classic expression for calculating the experimental variogram is as follows:
Where xi represents the locations of the samples, Y(xi) represents their values, and N(h) is the number of pairs (xi, xi + h). We will see in another article how to model experimental variograms in different cases.
If you are interested in obtaining more information on this topic or how to apply these concepts to your project, feel free to contact us at contacto@m2p.cl.
References:
Armstrong, M., Basic Linear Geostatistics, 1998, Springer Berlin Heidelberg.
Emery, X., 2013. Geostatistics. Universidad de Chile, Santiago, Chile.